







Measuring Progress Across the RCSA Network
River City Science Academy uses academic performance data to evaluate student progress, strengthen instruction, and support continuous improvement across campuses and grade levels.
The reports below provide an overview of recent assessment results, campus performance, Advanced Placement outcomes, and high school achievement.
Programs That Support Every Learner
Student Achievement
Review recent ELA and mathematics results across tested grade levels.

Campus Performance
Compare academic outcomes and school grades across RCSA campuses.

Advanced Placement
Explore AP participation, pass rates, and College Board recognition.

High School Outcomes
View graduation, college-readiness, and advanced-course performance indicators.

RCSA Score Card
Compare RCSA results with district and state performance across English Language Arts and mathematics.
| ELA | District | State | Math | District | State | ||
|---|---|---|---|---|---|---|---|
| 3rd | 76 | 51 | 57 | 3rd | 86 | 60 | 63 |
| 4th | 69 | 50 | 56 | 4th | 78 | 60 | 62 |
| 5th | 74 | 50 | 56 | 5th | 79 | 54 | 57 |
| 6th | 80 | 49 | 60 | 6th | 86 | 47 | 60 |
| 7th | 80 | 48 | 57 | 7th | 79 | 43 | 51 |
| 8th | 77 | 47 | 55 | 8th | 82 | 47 | 56 |
| 9th | 79 | 50 | 56 | Algebra | 93 | 57 | 60 |
| 10th | 84 | 53 | 57 | Geometry | 97 | 57 | 55 |
School Grades and Academic Indicators
Review campus-level performance across tested subjects, advanced coursework, graduation indicators, and overall school grades.
| School Name | Grade 3 English Language Arts Achievement | English Language Arts Achievement | English Language Arts Learning Gains | English Language Arts Learning Gains of the Lowest 25% | Mathematics Achievement | Mathematics Learning Gains | Mathematics Learning Gains of the Lowest 25% | Science Achievement | Social Studies Achievement | Middle School Acceleration Rate | Graduation on Rate | College and Career Acceleration Rate | Total Points | Total Components | Percent of Total Possible Points | 2025 School Grade |
|---|---|---|---|---|---|---|---|---|---|---|---|---|---|---|---|---|
| RCSA MH | 79 | 64 | 62 | 89 | 72 | 77 | 72 | 91 | 87 | 98 | 71 | 862 | 11 | 78 | A | |
| RCSA ELEMENTARY | 82 | 80 | 68 | 61 | 88 | 82 | 71 | 86 | 618 | 8 | 77 | A | ||||
| RCSA INNOVATION | 67 | 70 | 61 | 58 | 81 | 66 | 65 | 79 | 89 | 84 | 720 | 10 | 72 | A | ||
| RCSA MANDARIN | 76 | 82 | 72 | 59 | 86 | 73 | 63 | 76 | 94 | 86 | 767 | 10 | 77 | A | ||
| RCSA SOUTHEAST | 85 | 80 | 72 | 56 | 84 | 69 | 65 | 78 | 99 | 688 | 9 | 76 | A | |||
| RCSA CONSOLIDATED | 76 | 78 | 67 | 60 | 85 | 72 | 70 | 76 | 91 | 86 | 98 | 71 | 930 | 12 | 78 | A |
| DCPS | 53 | 52 | 57 | 54 | 56 | 58 | 58 | 57 | 72 | 83 | 91 | 76 | 763 | 12 | 64 | A |
AP Participation and Performance
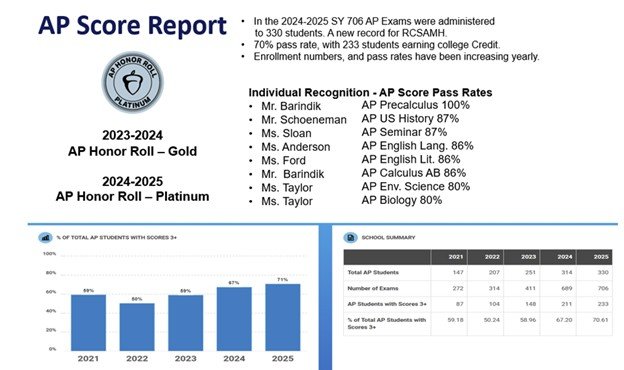
RCSA continues to expand access to Advanced Placement coursework while supporting students in earning qualifying AP exam scores and college credit opportunities.
College and Career Readiness
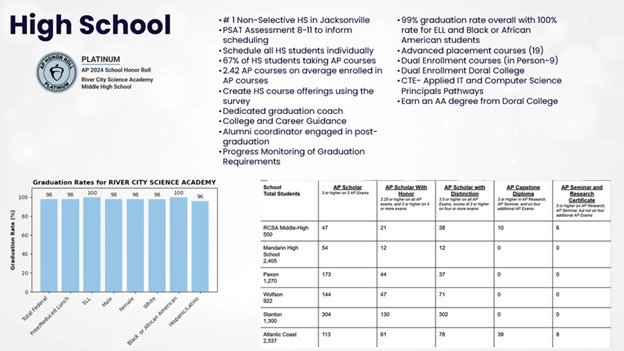
Explore high school achievement indicators, graduation outcomes, advanced coursework participation, and college-readiness measures.
About the Data
Performance results reflect the reporting periods, measures, and accountability criteria shown in each report. Assessment formats, course offerings, accountability calculations, and reporting requirements may vary by year, campus, grade level, and state policy.
Supporting Stronger Outcomes for Every Student
RCSA uses performance data, instructional review, and school-community collaboration to strengthen teaching, learning, and student achievement.